“How can I increase sales?” This is the most common question sales managers and owners ask themselves. But understanding how you are closing sales and who is your top salesperson is crucial in knowing the answer. It’s critical that you are aware of patterns pertaining to the average close time (ACT), win rate and number of closed deals. Armed with this data, you can make important decisions such as:
- Do my salespeople need more training?
- Do I hire more salespeople?
- Who are my top salespeople?
- Should I increase/decrease velocity of proposal deliveries?
With Proposable’s new Sales Stats, you can get a bird’s eye view of these KPI’s Here’s a quick breakdown:
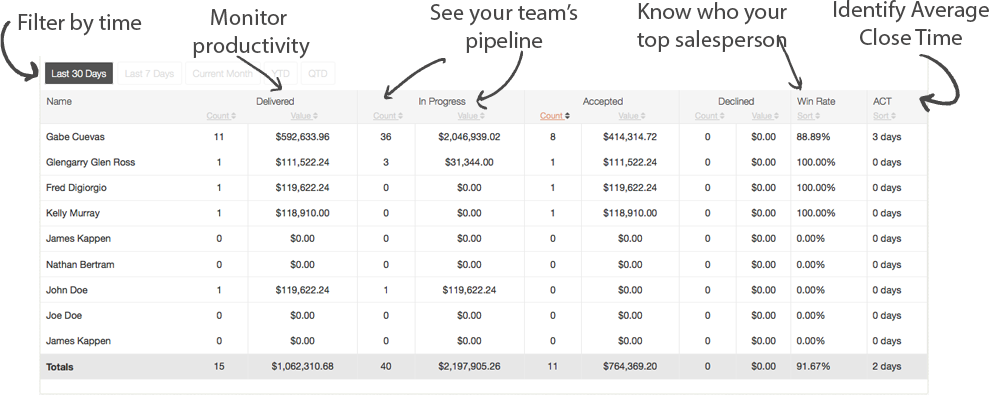
With this great new dashboard view, you will have a clearer picture of your sales outlook and sales team team trends:
1. Total sales by time period. The first metric to track is your sales across a period of time. For example, what are your sales month to date? Likewise, you may choose to track your sales by day or week. By tracking sales by time period, you know exactly how well you’re performing. You know if your sales are up versus the prior period, be it the prior day, week, month, quarter or year. And if sales aren’t up each period, you know you have work to do.
2. Deal Size. It’s important to see all deals and related deal size per salesperson so you can track quotas. Keeping a birds-eye-view of all salesperson deal stages has never been easier with a combination of the Team Stats Dashboards and the Proposal Stage View.
3. Average Close Time (ACT). This is particularly useful to get an idea of how each sales rep is doing in general. If you are seeing an average of 15 days across all of your salespeople, this will help you forecast and understand what your future sales will be.
4. Delivered vs. In Progress. When your salespeople are sending proposals all day long, it’s important to not only measure their productivity, but also how strong their pipeline is. With the Team Stats, this gives you an idea of what their velocity vs. closed deals look like. It will help you make decisions such as scaling up or down.
5. Win Rate %. Knowing who your strong leaders are will help you identify which salespeople will lead the pack. You can quickly pick up trends and teach others how to close more deals with historical data.
As we improve Proposable, we plan to add other Sales components to help you grow and manage your sales. Please feel free to send us an email to team@proposable.com to request features around sales.